Monitoring Nomad with Prometheus and Thanos

illustration by World Image on Bigstock
Introduction
If you’ve been around the cloud-native world for a while, I’m sure you have already heard of Prometheus, a graduated CNCF project for monitoring and alerting. It is one of the most widely adopted tool for monitoring in the Kubernetes ecosystem.
Prometheus’s local time series database stores all the data in a custom, highly efficient format on a local disk. By doing so, the storage is limited by the size of the disk and in fact, Prometheus is not build to keep the metrics data infinitely.
When running Prometheus at scale, one could leverage Prometheus Federation, where a Prometheus server to scrape selected time series from another Prometheus server, but there are some other Open Source projects available to power-up the popular monitoring tool.
Thanos, for example, is an open source, highly available Prometheus setup with long term storage capabilities. Thanos offers a set of components that runs next to your Prometheus instances and can be composed into a high available setup with long-term storage capabilities.
Key takeways:
- Global Query View: scale your Prometheus setup by enabling querying of your Prometheus metrics across multiple Prometheus servers and clusters.
- Unlimited Retention: extend the system with the object storage of your choice to store your metrics for unlimited time.
- Prometheus Compatible: implements the same Prometheus Query API, so you can use the same tools such as Grafana.
- Downsampling & Compaction: downsample historical data for massive query speedup when querying large time ranges or configure complex retention policies.
Some other projects providing long term storage for Prometheus are Cortex, M3 or VictoriaMetrics
Installing and running Thanos is becoming more and more widely adopted in the Kubernetes ecosystem, and most resources on how to install Thanos will most of the time target Kubernetes as the platform. In this tutorial, however, I would like to illustrate how this monitoring system can be installed on Nomad, a simple and flexible workload orchestrator, build by HashiCorp.
Thanos architecture
Before we dive into the details on how to deploy Thanos on Nomad, let’s have a look at the different components.
Thanos Sidecar
The Thanos Sidecar runs alongside your Prometheus server and uploads the Prometheus data on a regular base to your object storage bucket for long term storage. Besides uploading the data, it also implements the Store API to allow queriers to query the data in realtime with a common efficient API.
Thanos Store
The Thanos Store, or Store Gateway, implements the same Store API on top of the uploaded metrics in the object storage bucket.
Thanos Querier
The queriers implements the Prometheus HTTP API to query data in a Thanos cluster via PromQL. In other words, it has an interface similar to that of Prometheus and it handles the Prometheus query API. It gathers data from the underlying Store APIs (Sidecars and Stores) to return the relevant metrics.
Thanos Compactor
The compactor applies the compaction procedure to block data stored in object storage, and also responsible for downsampling of data.
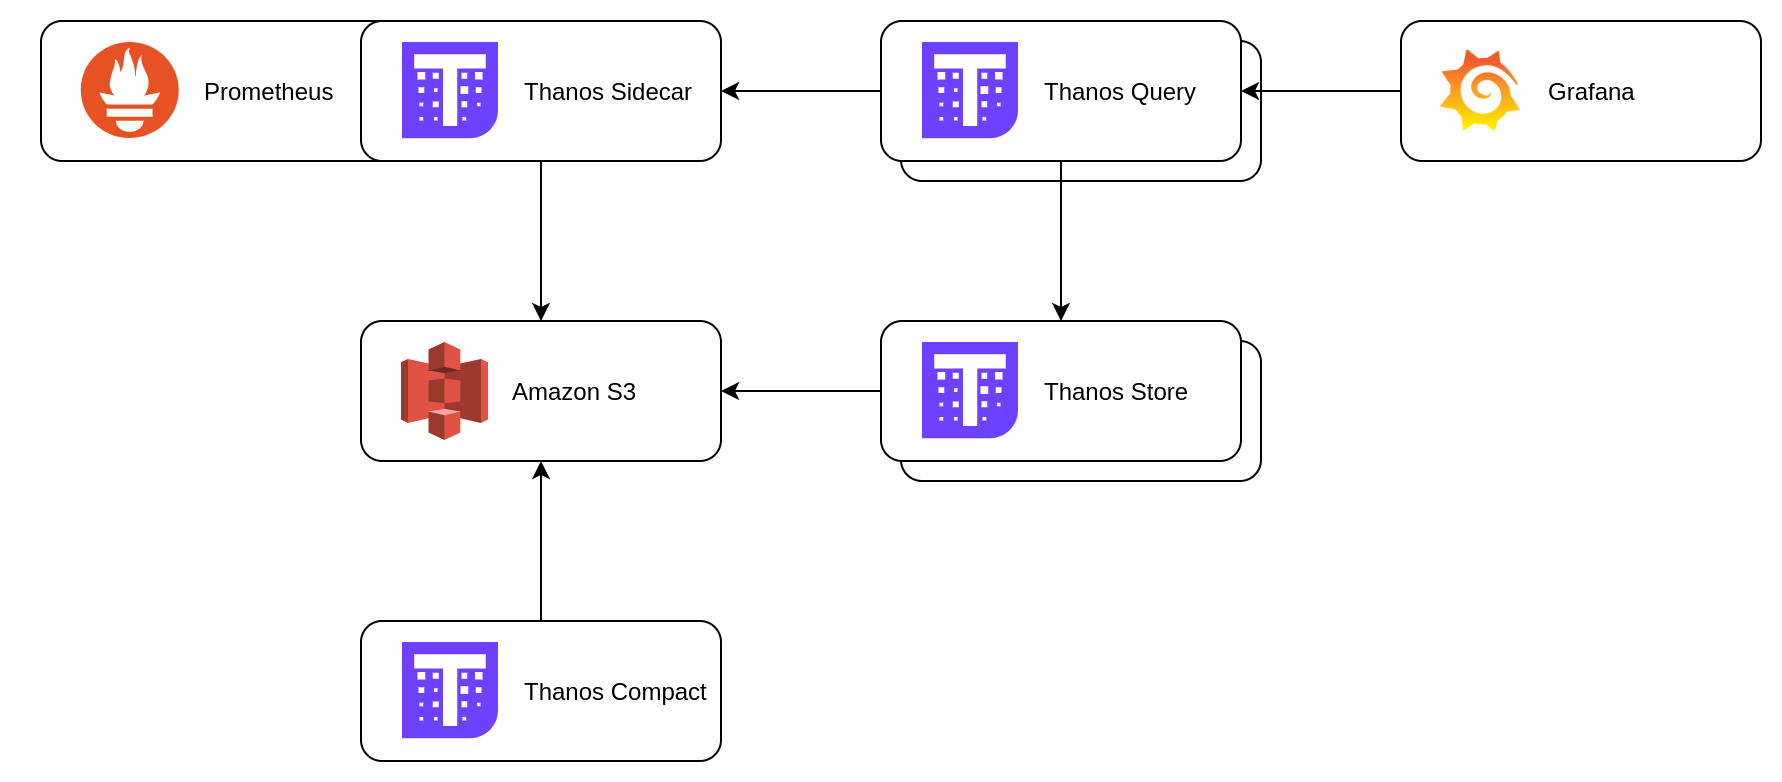
Minimal Thanos architecture
Deploying on HashiCorp Nomad
Prerequisites
For this guide, I have a Nomad environment with Consul ready.
Telemetry is enabled on the Nomad servers and clients with the following stanza in the configuration files:
telemetry {
  collection_interval = "1s"
  disable_hostname = true
  prometheus_metrics = true
  publish_allocation_metrics = true
  publish_node_metrics = true
}
Because Prometheus will write its data to a storage disk, and the Thanos Sidecar would like to read the same data, one of my Nomad clients has a host volume configured. Nomad host volumes can manage storage for stateful workloads running inside your Nomad cluster.
client {
  host_volume "prometheus" {
    path      = "/opt/prometheus/data"
    read_only = false
  }
}
For this guide, I chose to use a host volume because of the simplicity, but if your cluster is running on a public cloud provider, the Nomad Storage Plugins could be a good alternative. Storage plugins are third-party plugins that conform to the Container Storage Interface (CSI) specification.
For long time storage, I’ve created an Amazon S3 bucket and the required keys to upload the data.
Running a Fabio job
Create a job for Fabio named fabio.nomad with the following specification:
You can now register the Fabio job:
$ nomad run fabio.nomad
==> Monitoring evaluation "f388cf14"
    Evaluation triggered by job "fabio"
    Allocation "01498664" created: node "286b2700", group "fabio"
    Allocation "18074c86" created: node "de65f152", group "fabio"
    Allocation "67f90768" created: node "7236ff56", group "fabio"
    Evaluation status changed: "pending" -> "complete"
==> Evaluation "f388cf14" finished with status "complete"
At this point, you should be able to visit any one of your client nodes at port 9998 and bring up the web interface for Fabio. The routing table will be empty since you have not yet deployed anything that Fabio can route to. Accordingly, if you visit any of the client nodes at port 9999 at this point, you will get a 404 HTTP response. That will change soon.
To learn more about Fabio and the options used in this job file, consult Load Balancing with Fabio.
Running the Thanos monitoring job
Create a job for Thanos named monitoring.nomad with the following specification, and replace the values for the S3 configuration with your proper values (like bucket name, access key, etc…) For the purpose of this guide, those values are written in plain text in the job specification, a more secure and recommended approach is to enable the Vault integration and fetch those credentials from this secret management tool.
You can now register the monitoring job:
$ nomad run monitoring.nomad
==> Monitoring evaluation "a5b41399"
    Evaluation triggered by job "monitoring"
    Evaluation within deployment: "a05ce469"
    Allocation "32a5252b" created: node "286b2700", group "thanos-compactor"
    Allocation "94760531" created: node "286b2700", group "thanos-query"
    Allocation "9e1a61d7" created: node "7236ff56", group "thanos-store"
    Allocation "c1d206d7" created: node "286b2700", group "prometheus"
    Evaluation status changed: "pending" -> "complete"
==> Evaluation "a5b41399" finished with status "complete"
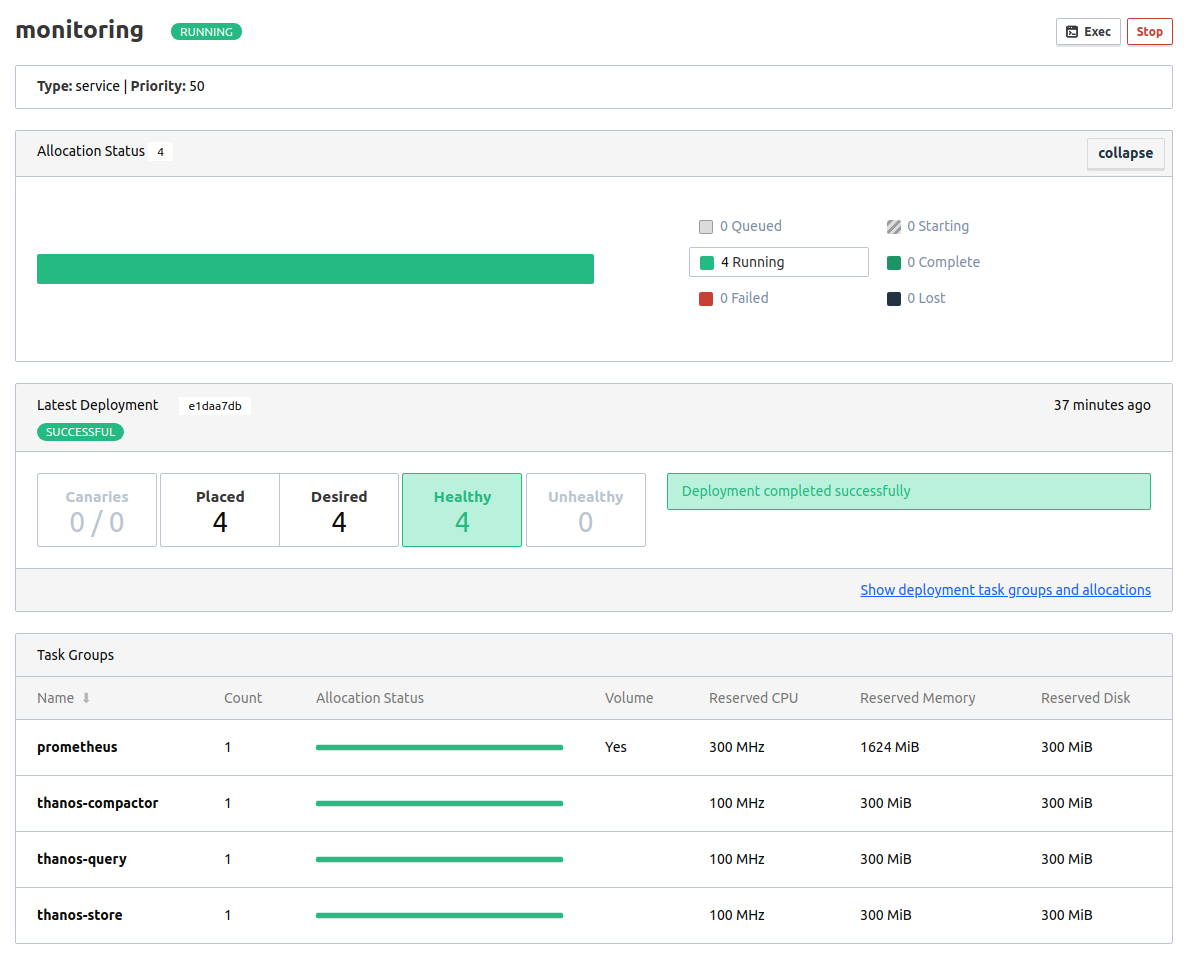
A few moments later, all the tasks should be scheduled and running healthy. As you can see, this job specification has multiple task groups, each of them defining one of the Thanos components which are described earlier.
Nomad task group running Prometheus and Thanos Sidecar
Prometheus and Thanos Sidecar
The first task group, prometheus, will start a Prometheus server. Notice the use of the template stanza to create a Prometheus configuration. In this case, the job uses the unique IP address of the worker node in the consul_sd_config section to ensure Prometheus can use Consul to detect and scrape targets.
The Prometheus container is using the mounted host volume mentioned earlier to write its storage data.
Besides the Prometheus server, we also install the Thanos Sidecar as a second task within the same task group, meaning both tasks will share the same network space and can mount the same host volume.
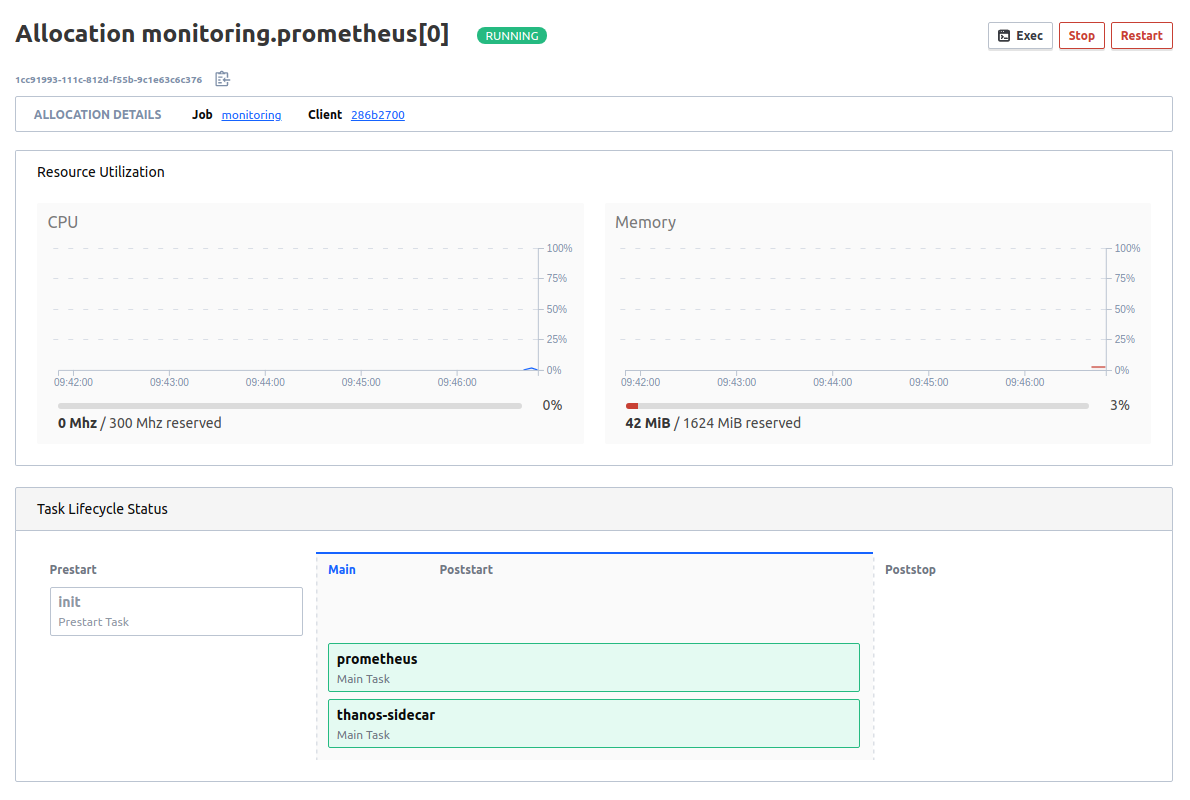
Nomad task group running Prometheus and Thanos Sidecar
Thanos Querier and Service Discovery
As the Thanos querier will gather the data from the underlying Store APIs, it needs to know how to reach those services. To achieve this, Thanos has its own implementation of Service Discovery to find the API targets to perform certain operations. You would think it can use Consul as Service Discovery mechanism, but unfortunately, Consul integration is not yet available in Thanos. As a workaround, I’m using the File Service Discovery. With File SD, a list of files can be watched for updates, and the new configuration will be dynamically loaded when a change occurs.
With the Nomad template stanza, such file is generated, based on services registered on Consul, and updated whenever a new instance is becoming healthy on Consul.
template {
  change_mode = "restart"
  destination = "local/targets.yml"

  data = <<EOH
- targets:{{ range service "thanos-sidecar" }}{{if .Tags | contains "grpc"}}
    - '{{ .Address }}:{{ .Port }}'{{ end }}{{ end }}
- targets:{{ range service "thanos-store" }}{{if .Tags | contains "grpc"}}
    - '{{ .Address }}:{{ .Port }}'{{ end }}{{ end }}
EOH
}
With this technique, the Thanos Querier is always able to reach all the sidecars and stores on our cluster.
Prometheus and Thanos Query UI
When this monitoring job is deployed, you can visit any of your client nodes at port 9999 to visit the web interface of Prometheus or the Thanos Query component.
Let us first have a look at Prometheus. Because of the proper tags and configuration, Prometheus is available at /prometheus.
At the top menu bar, click on Status and then Targets. The target list should include all of your Nomad nodes. Note that the IP addresses will be different in your cluster.
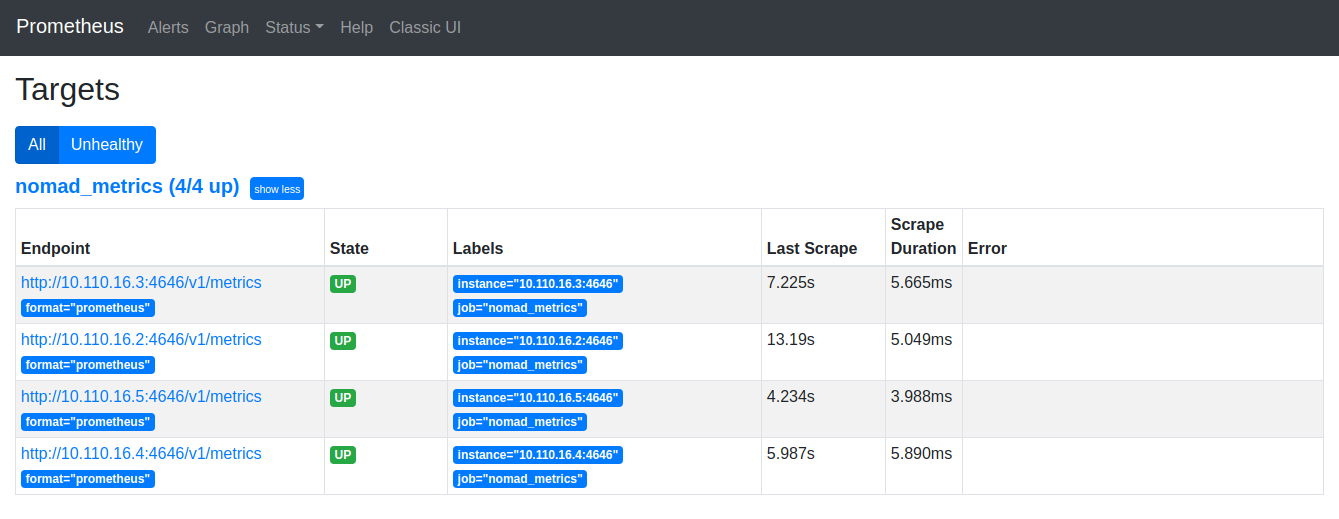
Prometheus scraping all the Nomad nodes
Now, we could use this Prometheus to query how many jobs are running in our Nomad cluster, but instead we will use the Thanos Querier to have a view on the metrics. Just like Prometheus, the Thanos Query UI is available at port 9999 of any of your client nodes, but at path /thanos. You will notice that the Thanos UI is very similar to the Prometheus UI.
At the top menu bar, click on Stores. The Thanos Sidecar and the Thanos Store in our cluster should be displayed in the list.

Thanos Query displaying all our Store API endpoints
Use Thanos to query how many jobs are running in our Nomad cluster. On the main page, type nomad_nomad_job_summary_running into the query section. You can also select the query from the drop-down list.
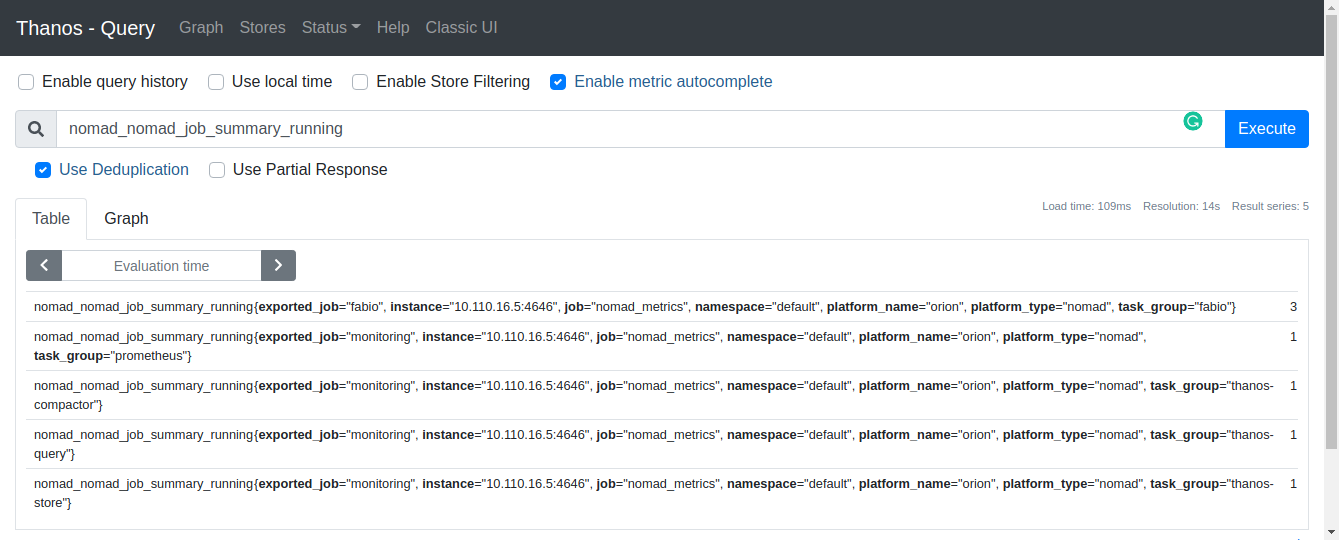
Query metrics with Thanos
The value of our Fabio job is 3 since it is using the system scheduler type. This makes sense because there are three running Nomad clients in my cluster.
The value of the other jobs, like thanos-store and thanos-compactor, are 1 since we have only deployed one instance of those task groups.
Next steps
By now, you should a have a good idea on how Thanos can be deployed on a Nomad cluster. In the example only one instance of each component is configured, but the team development has done a good job making sure each of them can scale easily. The Thanos Sidecar running alongside the Prometheus server is uploading the data to a storage bucket, providing us long term storage. While the Thanos Store component makes the data in the storage bucket available, the Thanos Querier can target both the Thanos Sidecar and Thanos Store to give an aggragated view.
So, what’s next?
Now that we have enabled Prometheus with Thanos to collect metrics from our cluster and verified the state of our jobs, we can deploy the Thanos Ruler component with an Alertmanager.
Or, if you want to have some nice dashboard, deploy a Grafana server. Remember that the Thanos Querier implements the same API as a Prometheus server, which means Grafana has support for Thanos out-of-the-box. Just configure the querier as a Prometheus datasource, and you can start making dashboard for all the live metrics from the Thanos Sidecar and the metrics stored in the buckets via the Thanos Stores.
Start collecting those metrics!
See also:
- Deploying a highly-available Nomad cluster with hashi-up
- Building a Nomad cluster on Raspberry Pi running Ubuntu server
- Installing HashiCorp Vault on DigitalOcean with hashi-up
References:
cloud-nativedevopsnomadconsulhashicorpprometheusthanosmonitoringobservabilitymetricshigh availability
1848 Words
Dec 20, 2020